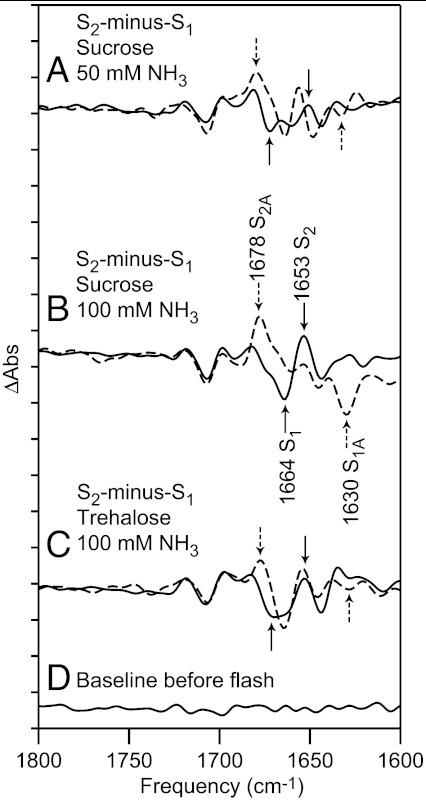
Fig. 6.
The 1,800 - 1,600 cm-1 region of the reaction-induced FT-IR spectra, associated with the S2-minus-S1 transition in PSII. The data were acquired in 0.4 M sucrose buffer, pH 7.5 (A and B) or 0.4 M trehalose buffer, pH 7.5 (C). The spectra were acquired after the addition of (A, solid) 50 mM NaCl, (A, dashed) 50 mM NH3, (B and C, solid) 100 mM NaCl, or (B and C, dashed) 100 mM NH3. In (B), bands discussed in the text are labeled S1, S2 if observed in a control sample and S1A, S2A if observed in an ammonia treated sample. In (D), a representative baseline is shown. The spectra are averages of data obtained from (A) 8, (B) 14, (C) 12, and (D) 14 samples. The y-axis tick marks represent 1 × 10⁻⁴ absorbance units.

