Fig. 6.
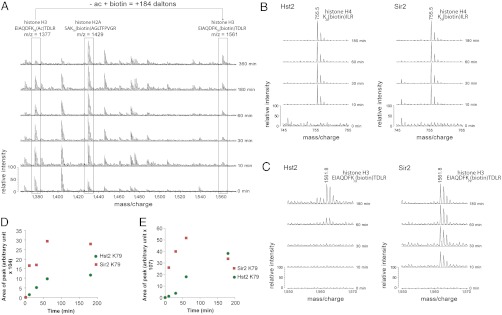
Histone H3 K79 is preferentially deacetylated by Sir2 in comparison to Hst2. (A) MALDI mass spectra of time courses of Sir2-mediated histone deacetylation demonstrating the decrease in peak intensity of acetylated peptides along with increases in peak intensities of their biotinylated counterparts. (B) Histone samples deacetylated by Sir2 or Hst2 demonstrate a similar rate of appearance of a MALDI-TOF peptide peak at 755.5 m/z, corresponding to the biotinylated histone H4 peptide K20(biotin)ILR. (C) Comparison of the appearance of a 1,561.8 m/z peptide from MALDI-TOF corresponding to the histone H3 peptide EIAQDFK79(biotin)TDLR. (D) A graph showing the area of biotinylated K79 peaks at each timepoint in C reveals a preference of Sir2 deacetylation activity (red squares) over Hst2 (green circles) for this peptide. (E) Areas of peaks from Hst2 and Sir2 LC MS/MS data of biotinylated H3 K79 peptide (EIAQDFK79(biotin)TDLR) also shows a Sir2 preference for K79 (red squares) over Hst2 (green circles), supporting the MALDI-TOF data in D. Each datapoint represents the area of biotinylated peptide from extracted ion chromatograms (XICs) of MS1 data at the various timepoints.

