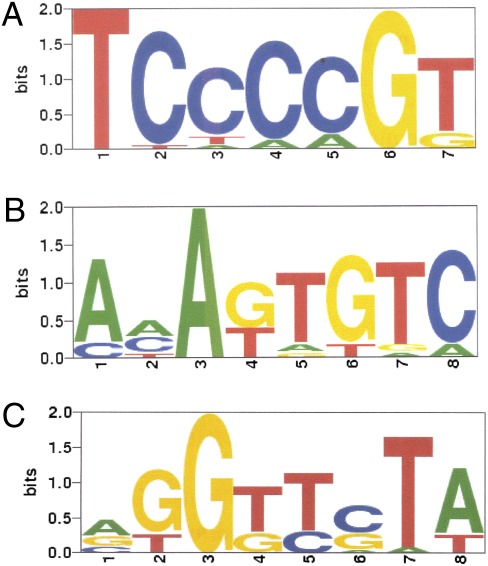
Fig. 4.
TLS-binding motifs modeled as PSAMs determined by MatrixREDUCE. (A) The first PSAM that best explains the variance in the normalized ChIP enrichment (MAT) scores using only the forward strand (R2 0.17, P value 2.54e-42). The height of each letter is proportional to its corresponding nucleotide's relative affinity at each position, and the letters are sorted in descending frequency order. The height of the entire stack at each position is then adjusted to signify the information content (in bits) of that position. (B) The second PSAM that best explains the variance in the residuals from the fit with the first PSAM, again using only the forward strand (R2 0.18, P value 2.2e-45). (C) The third PSAM that best explains the variance in the residuals from the fits with the first and second PSAMs, using both strands (R2 0.08, P value 3.4e-20).

