
Fig. 1.

Experimental and simulation results of motor-protein traffic jams on microtubules. (A, Upper) Schematic of the dual-color in vitro assay. (Lower) Schematic of the simulation with lattice-association ( ), lattice-dissociation (
 ), and end-dissociation (
 ) probabilities. N is the number of sites on the lattice. (B) Dual-color kymograph showing the motor density in red (Kip3-mCherry, 3.2 nM) and the trajectories of individual motors in green (Kip3-EGFP, < 0.05 nM) in the presence of 30 mM KCl. The top of the kymograph corresponds to the time when the motors were added to the microtubule. (C) Simulated kymograph using the following parameters (see text):
 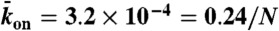 with N = 750, corresponding to an association rate with 3.2 nM Kip3-mCherry in solution,
 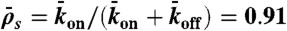 , and
, and 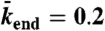 .
.