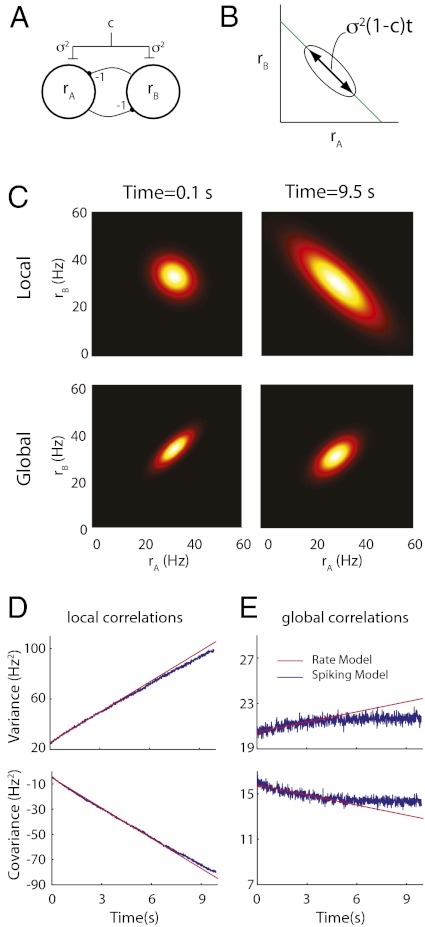
Fig. 3.
Phenomenological random walk firing rate model of persistent activity. (A) Schematic showing the rate model framework with  (the total input variance to a population) and
  (the input correlation given to the two models). (B) Schematic showing the line attractor (green line) and trial variable spread along the attractor (circle). (C) The probability density
  shown for
  s (Left) and
  s (Right) for the model with local (Upper) and global (Lower) correlations. The density is Gaussian, with mean and variance calculated from the associated Fokker–Planck equation (SI Materials and Methods). (D) Comparison between the population rate variance (Upper) and covariance (Lower) computed from the spiking network simulations and the analytic solutions from the firing rate model. Both networks had local correlated fluctuations (
 for firing rate model). E is the same as D but for the models with global fluctuations (
 for firing rate model).

