
Fig. 4.

Global correlations improve task performance in a two-interval, delayed response discrimination task. (A) Schematic showing the stimulation during the loading, maintenance, and decision stages of the task. (B) Spiking network population firing rates (populations A and B) during one trial of the task (local correlations). At the decision stage, the model performed the correct decision ( ). (C) Population A firing rates for two separate but otherwise identical trials of the task. The fluctuations cause one trial to produce the incorrect decision. (D) Analytic densities
  for the rate model with
  s for local (Upper) and global (Lower) correlations for tasks where
  is large (Left) or small (Right). (E) Probability of correct decision for the firing rate model in (
 ,
,  ) parameter space computed from integrals of
 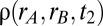 . The dots correspond to the four cases shown in C. (F) Probability of correct decision computed from the spiking model (5,000 trials) as a function of
  for local and global correlations.