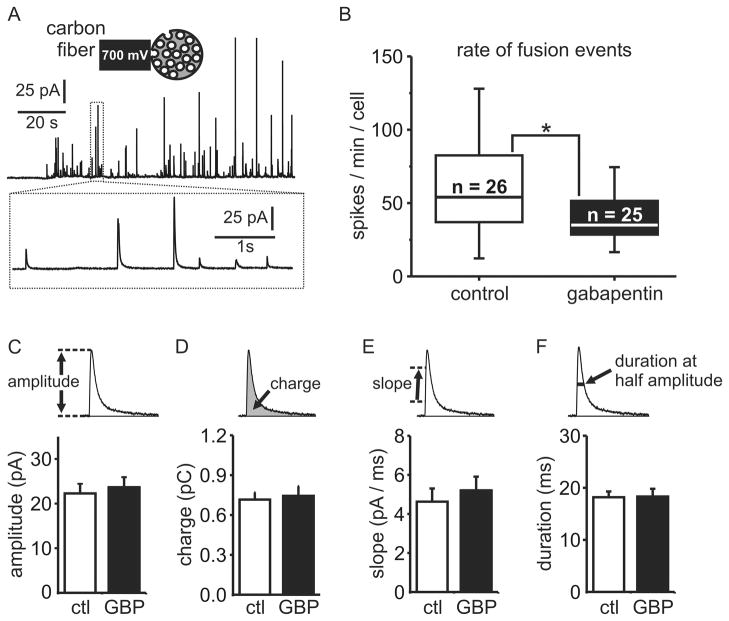
Figure 5. Gabapentin reduces the number of secretory vesicle fusion events but not the quantal size or kinetics of catecholamine release from each vesicle.
Carbon fiber amperometry was used to quantify the number, quantal size, and kinetics of individual vesicular fusion events. (A) A representative amperometry recording from a control cell stimulated with 30 mM KCl. Each upward deflection (spike) on the current trace is produced by oxidation of the catecholamines released from a single vesicular fusion event. The inset shows a cartoon representation of the recoding configuration (above) and an expanded view of a few spikes is shown below. (B) The number of amperometric spikes was determined for each cell over a 2-min period. The box graph shows the 25th percentile, median, and 75th percentile distribution of vesicular fusion rate (spikes per minute) for control cells (n = 26 ) and cells treated for 18–24 hours with 1mM gabapentin (n = 25). The whiskers represent the smallest and largest non-outliers in each population of cells. Gabapentin produced a statistically significantly reduction in the rate of fusion events compared to matched controls (* p = 0.046, Mann-Whitney test). (C–F) Other parameters of the amperometric spikes (amplitude, charge, slope, and duration) were analyzed and a median value for each cell calculated. Pooled values (mean ± SEM) for each parameter are shown and were compared. No statistically significant differences were found between gabapentin treated cells (GBP) and control cells (ctl).

