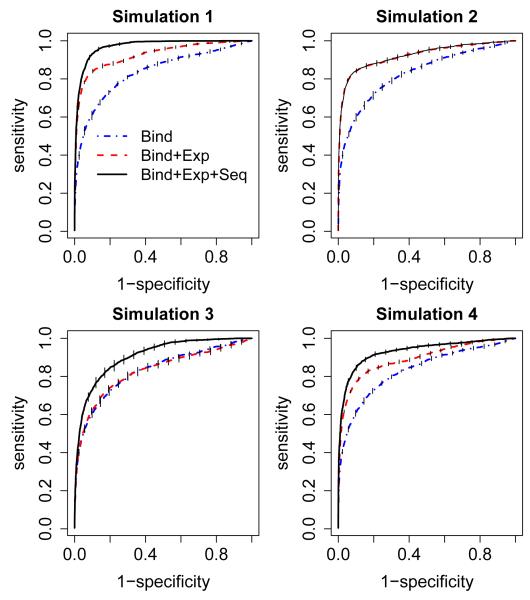
Figure 2.
ROC curves for simulation studies 1-4. Each simulation study was performed 10 times, the mean and standard errors of sensitivities (the vertical tick marks on the line) were used to evaluate the performance of each model.Bind: using binding data alone; Bind+Exp: using binding data and expression data; Bind+Exp+Seq: using binding data, expression data and sequence data.

