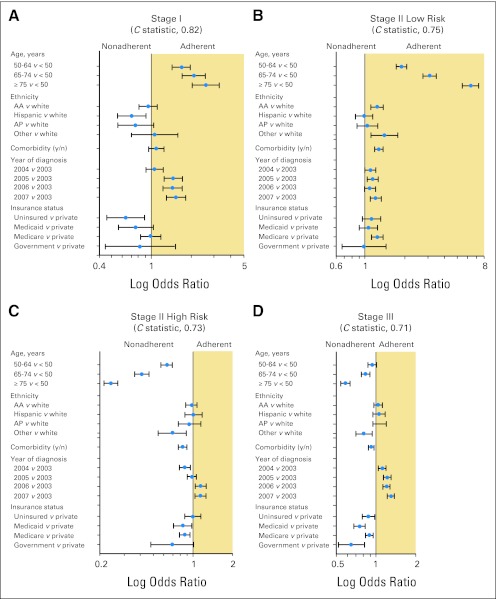
Fig 4.
Forest plot of factors predicting adherent treatment for (A) stage I, (B) stage II low-risk, (C) stage II high-risk, and (D) stage III disease. Odds ratios (blue dots) are shown with associated 95% CIs (horizontal lines). Models were also adjusted for sex, education, income, geographic region, and facility type as appropriate. Government includes federal insurance programs such as Veterans Affairs, TRICARE/Military, and Public Health Service. AA, African American; AP, Asian/Pacific Islander.

