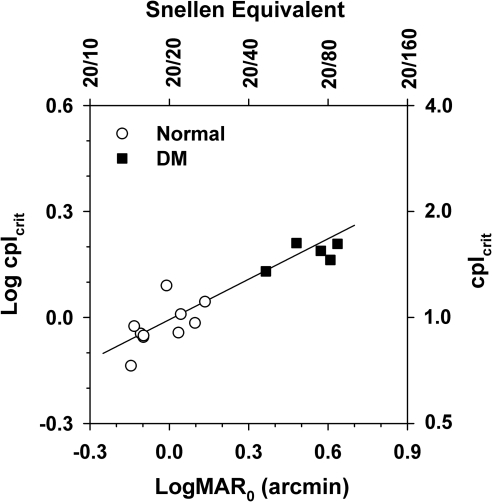
Figure 4.
Log object frequency (cplcrit) as a function of logMAR0 for the normally sighted subjects and patients with DM. The right y-axis shows the linear values of object frequency and the top x-axis shows the Snellen equivalents of the logMAR0 values. Solid line represents least-squares best-fit linear regression line.

