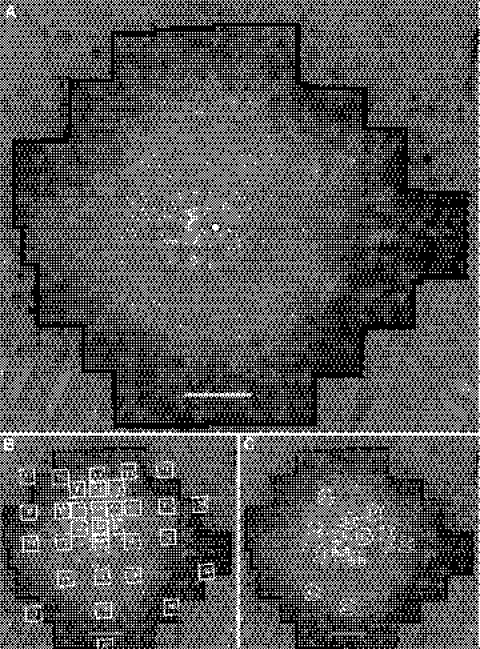
Figure 2.
(A) AOSLO image of the left eye of patient 1. (B) Fundus-guided microperimetry scores superimposed on AOSLO image. (C) Cone spacing z-scores superimposed on AOSLO image. Sensitivities are reduced by 1 to 2 log units, and cone spacing is increased by 2.3 to 5.7 SD from normal. The white circle with a black outline indicates the preferred locus for fixation, which coincides with the anatomic fovea. Scale bar, 1° (∼300 μm).

