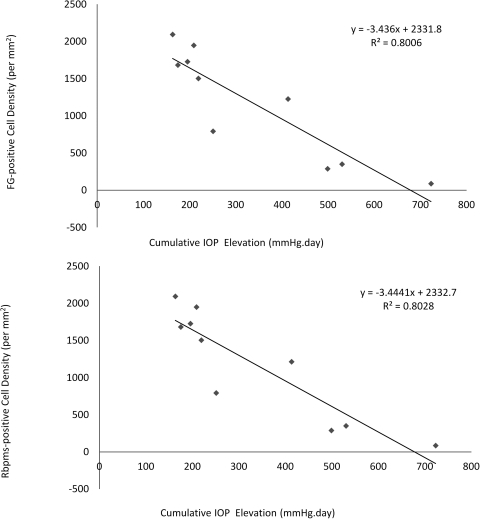
Figure 6.
Quantification of RGCs by FG and Rbpms labeling 5 weeks after IOP elevation. (A) Relationship between density of FG-positive cells and cumulative IOP elevation. There was a declining number of FG-positive cells when the cumulative IOP elevation increased. (B) Relationship between density of Rbpms-positive cells and cumulative IOP elevation. As the cumulative IOP increased, a similar linear trend of decreasing number of Rbpms-positive cells was noted. The levels of cumulative IOP elevation were adjusted by the area of trabecular meshwork (ranging from 330° to 360°) that received laser photocoagulation.

