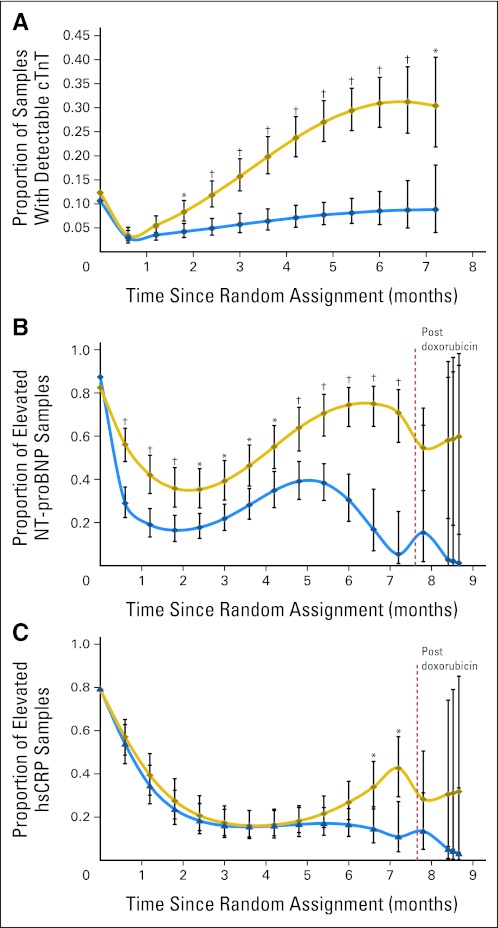
Fig 2.
(A) Model-based estimated probability of having an increased cardiac troponin T (cTnT) level at each depicted time point in patients treated with doxorubicin, with or without dexrazoxane. The doxorubicin-dexrazoxane group is indicated by the blue line, the doxorubicin group by the gold line. Vertical bars show 95% CIs. Increased cTnT is defined as a value greater than 0.01 ng/mL. *P value versus dexrazoxane group ≤ .05; †P value versus dexrazoxane group ≤ .001. An overall test for dexrazoxane effect during treatment was significant (P < .001). (B) Model-based estimated probability of having an increased N-terminal pro-brain natriuretic peptide (NT-proBNP) level at each depicted time point in patients treated with doxorubicin with or without dexrazoxane. The dexrazoxane group is indicated by the blue line, the doxorubicin group by the gold line. Vertical bars show 95% CIs. Increased NT-proBNP is defined as a value ≥ 150 pg/mL for children younger than 1 year old and a value ≥ 100 pg/mL for children age ≥ 1 year. *P value versus dexrazoxane group ≤ .05; †P value versus dexrazoxane group ≤ .001. An overall test for dexrazoxane effect during treatment was significant (P < .001) and after treatment was not significant (P = .24). (C) Model-based estimated probability of having an increased high-sensitivity C-reactive protein (hsCRP) level at each depicted time point in patients treated with doxorubicin with or without dexrazoxane. The dexrazoxane group is indicated by the blue line, the doxorubicin group by the gold line. Vertical bars show 95% CIs. Increased hsCRP is defined as a level ≥ 1.9 mg/L. *P value versus dexrazoxane group ≤ .05. Overall tests for dexrazoxane effect during treatment (P = .08) and after treatment (P = .49) were not significant.

