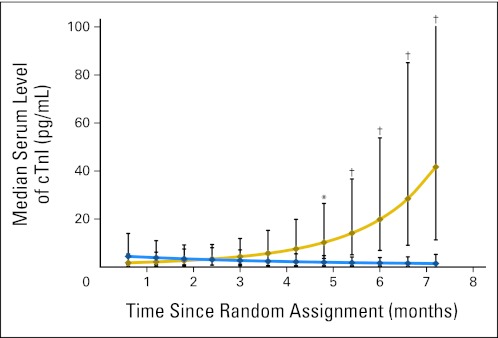
Fig 3.
Median serum cardiac troponin I (cTnI) levels during doxorubicin therapy of a 40-sample subset from 18 children with high-risk acute lymphoblastic leukemia. The dexrazoxane group is indicated by the blue line, the doxorubicin group by the gold line. Vertical bars show 95% CIs. *P value versus dexrazoxane-doxorubicin group ≤ .05; †P value versus dexrazoxane group ≤ .001.

