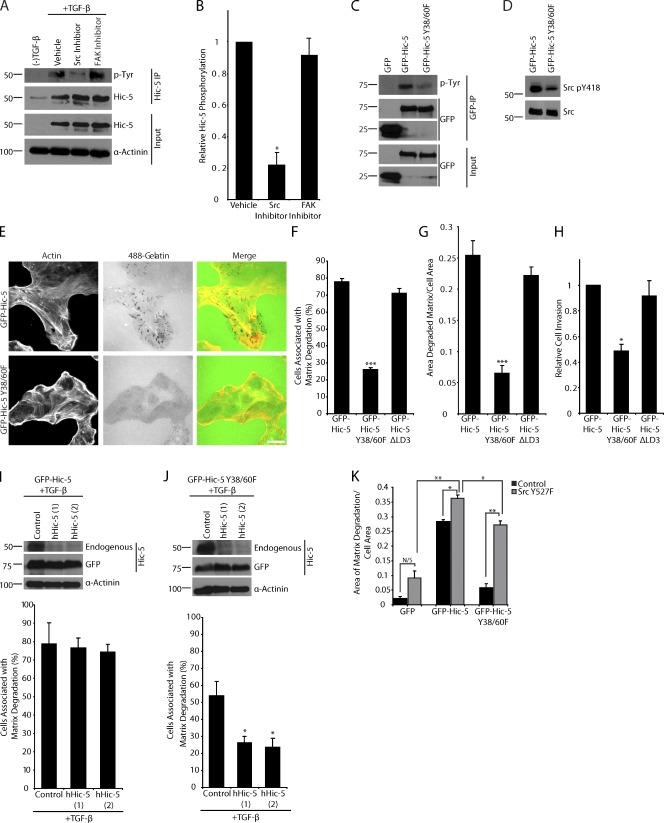
Figure 5.
Hic-5 phosphorylation is required for matrix degradation and invasion. (A) Immunoprecipitation of endogenous hHic-5 from TGF-β–treated MCF10A cells demonstrates that Hic-5 is tyrosine phosphorylated, and inhibition of Src with PP2 reduces Hic-5 phosphorylation, whereas the FAK inhibitor PF573228 had no effect. (B) Quantitation of the ratio of tyrosine-phosphorylated Hic-5 to total Hic-5 normalized to vehicle-treated cells. (C) Immunoprecipitation of GFP, mouse GFP–Hic-5, and mouse GFP–Hic-5 Y38/60F shows that Y38/60 constitute the major sites of Hic-5 phosphorylation. (D) Western blot analysis shows that levels of Src pY418 are reduced in GFP–Hic-5 Y38/60F–expressing cells. (E) GFP–Hic-5 and GFP–Hic-5 Y38/60F cells plated on fluorescent 488 gelatin show a decrease in matrix degradation in the GFP–Hic-5 Y38/60F mutant–expressing cells. Bar, 20 µm. (F) Quantitation of the percentage of cells associated with matrix degradation. (G) Quantitation of the area of degraded matrix per cell area. (H) Matrigel invasion is reduced in cells expressing the GFP–Hic-5 Y38/60F mutant. (I) Treatment of mouse GFP–Hic-5–expressing cells with TGF-β results in the up-regulation of endogenous hHic-5, which can be depleted by hHic-5 siRNA (hHic-5). Matrix degradation is not changed with TGF-β treatment or the depletion of endogenous Hic-5. (J) Treatment of GFP–Hic-5 Y38/60F cells with TGF-β results in the expression of endogenous Hic-5 and an increase in matrix degradation that is reversed with RNAi of the endogenous hHic-5. Molecular mass standards are indicated next to the gel blots in kilodaltons. (K) Quantitation of the area of degraded matrix/cell area in cells transfected with active Src Y527F demonstrates that active Src (Y527F) cannot promote matrix degradation in GFP-expressing cells, but that it does so in the GFP–Hic-5 and GFP–Hic-5 Y38/60F cells. Error bars represent the standard error of the mean. *, P < 0.05; **, P < 0.005; ***, P < 0.0005.

