Figure 3.
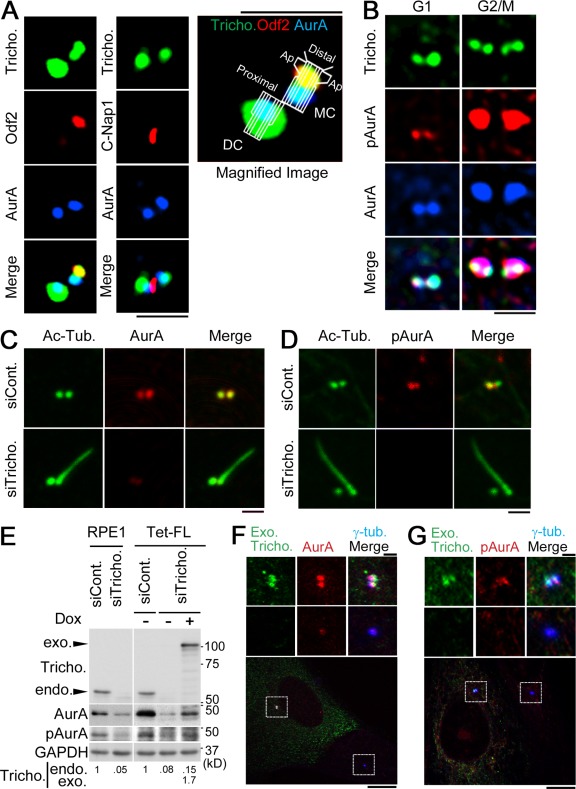
Centriolar localization of trichoplein is correlated with that of AurA and Thr288–pAurA especially in G1 phase. (A and B) RPE1 cells were subjected to the immunofluorescence staining with the indicated antibodies. MC, mother centriole; DC, daughter centriole; Ap, appendage. (C–E) Proliferating RPE1 cells were transfected with the indicated siRNA for 48 h and then subjected to immunocytochemistry (C and D) or immunoblotting (E, left; also see Fig. S1 C). The quantification data of centrosomal anti-AurA signals were shown in Fig. S1 D. siCont., control siRNA; siTricho., trichoplein siRNA; Ac-Tub., acylated tubulin. (E–G) We proceeded with the rescue experiment of endogenous (endo.) trichoplein depletion as described in the legend to Fig. 2 (E–G), with the indicated markers for additional immunoblotting (E, right), the quantification (E, bottom), and immunofluorescence (F and G). The cells were stained with anti-MBP (to detect the exogenous trichoplein [Exo. Tricho.]), anti-AurA or pAurA, and anti–γ-tubulin. Insets highlight the correlation. The quantification data of centrosomal anti-AurA and anti-pAurA signals were shown in Fig. S1 (E and F), respectively. Bars: (A–D, F [top], and G [top]) 1 µm; (F [bottom] and G [bottom]) 10 µm.

