Figure 3.
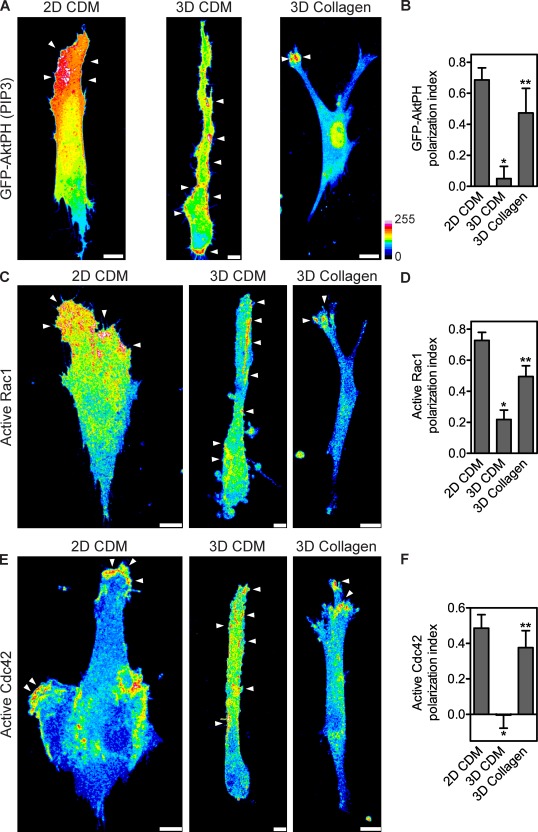
Nonpolarized PIP3, Rac1, and Cdc42 signaling during lobopodia-based 3D migration. (A) Maximally projected confocal stacks of HFFs expressing GFP-AktPH to detect PIP3, migrating on the 2D CDM, in the 3D CDM, or inside 1.7 mg/ml of 3D collagen. Images were pseudocolored according to the 16-color scale. Bars, 10 µm. (B) Mean PI of GFP-AktPH in HFFs migrating in the indicated ECM environments. (C–F) Localization of active Rac1 and Cdc42 away from the leading edge during lobopodia-based 3D migration inside the CDM. (C and E) Maximally projected confocal stacks of HFFs expressing Rac1 (C) or Cdc42 (E) biosensors migrating on the 2D CDM (left), in the 3D CDM (middle), or in 3D collagen (right). The Fc images, representing the total activity of each GTPase, were pseudocolored according to the 16-color scale. Arrowheads indicate regions of intracellular signaling. Bars: (3D CDM) 5 µm; (collagen and 2D CDM) 10 µm. (D and F) Mean PI of active Rac1 (D) and active Cdc42 (F) in HFFs migrating in the indicated ECM environments. All cells are oriented with the leading edge toward the top of the figure. Error bars show means ± SEM. *, P < 0.05 versus the 2D CDM; **, P < 0.05 versus the 3D CDM.

