Figure 7.
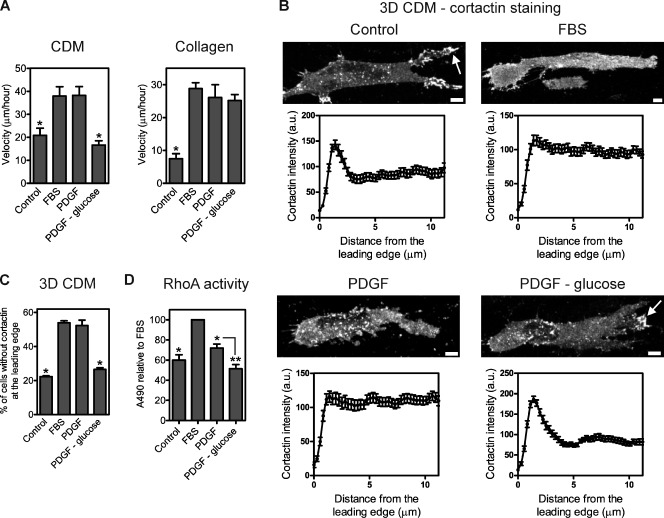
Regulation of the mode and efficiency of normal 3D cell migration by extracellular soluble factors. (A) 10 ng/ml PDGF in glucose-deficient media specifically reduces cell velocity in the CDM versus collagen. Quantification of cell velocity in the CDM or collagen in response to DME with 25 mM glucose (control), 10% FBS in DME with 25 mM glucose (FBS), 10 ng/ml PDGF in DME with 25 mM glucose (PDGF), or 10 ng/ml PDGF in glucose-deficient DME (PDGF − glucose). *, P < 0.05 versus FBS. (B) Representative images of cortactin localization in HFFs in the 3D CDM treated as indicated and quantified in C. Arrows indicate the local accumulation of cortactin at the leading edge. Bottom graphs correspond with their respective top images and represent the mean cortactin intensity measured from the leading edge (0 µm) toward the cell center. Each cortactin intensity profile was averaged from 13 cells, with three measurements per cell. (C) Quantification of the percentage of cells without enrichment of cortactin at the leading edge in B. *, P < 0.001 versus FBS. (D) Treatment of HFFs with 10 ng/ml PDGF in glucose-deficient media reduces cellular RhoA activity by ∼50%. RhoA activities in HFFs treated on tissue-culture plastic as indicated were measured using G-LISA activation assays. Absorbance values were normalized to the relative amount of actin in each sample before comparison with the FBS treatment. *, P < 0.01 versus FBS; **, P < 0.05 versus PDGF. Cells are oriented with their leading edge toward the right of the figure. Bars, 5 µm. a.u., arbitrary unit.

