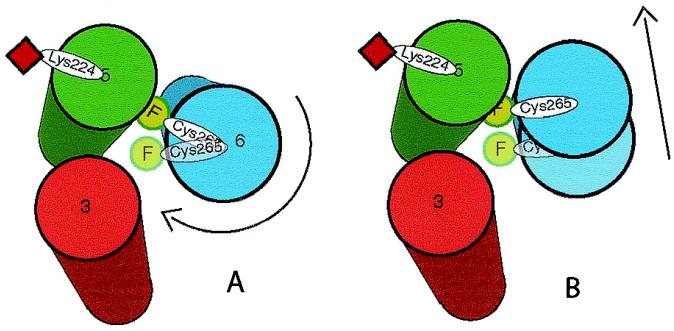
Figure 5.
A schematic indicating agonist-induced conformational changes in around Cys-265. The model represents TM domains 3, 5, and 6, as viewed from the cytoplasmic surface of the receptor, arranged according to the crystal structure of rhodopsin. In the inactive receptor, FM (green circle) on Cys-265 is predicted to point toward the cytoplasmic extensions of TMs 3, 5, and 6. Also shown is the predicted position of the quencher oxyl-NHS on Lys-224 (red square). The results from quenching experiments can best be explained by either a clockwise rotation of TM6 (A) and/or a tilting of TM6 (B) toward TM5 during agonist-induced activation of the receptor, as described in the text.

