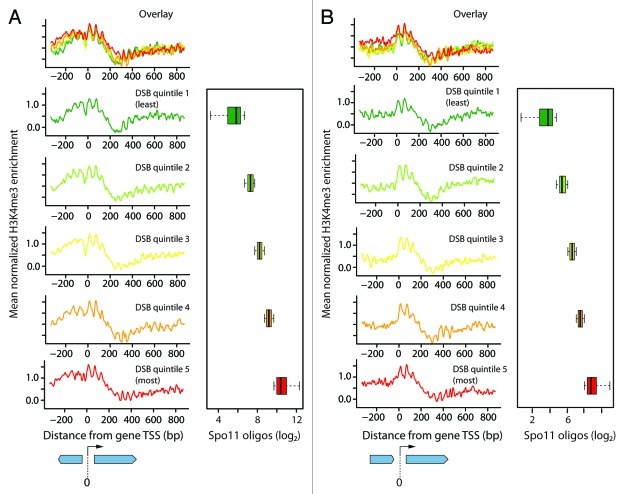
Figure 3. Histone marks around transcription start sites of genes. Mean normalized H3K4me3 enrichment at non-regulated genes with upstream genes in divergent orientation (A) or tandem orientation (B) (n = 1668 and 1491, respectively). Data are plotted in 3 bp bins and smoothed. Genes were divided into quintiles by Spo11 oligo count in their promoter. TSS is at 0 bp. Box plots show distribution of Spo11 oligo counts for each quintile.

An official website of the United States government
Here's how you know
Official websites use .gov
A
.gov website belongs to an official
government organization in the United States.
Secure .gov websites use HTTPS
A lock (
) or https:// means you've safely
connected to the .gov website. Share sensitive
information only on official, secure websites.
