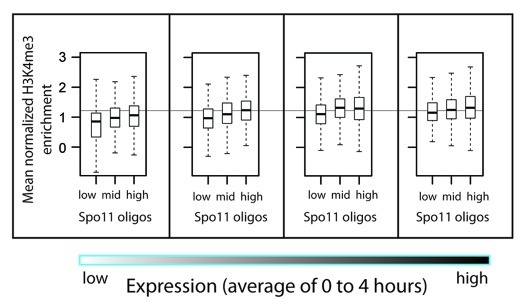
Figure 4. H3K4me3 enrichment for promoter hotspots grouped by steady-state RNA levels. Non-regulated genes were divided into quartiles by average transcript level, then further divided into thirds based on Spo11 oligo counts within the promoters (see text). Box plots show the distribution of H3K4me3 enrichment for the +1 nucleosomes of the genes in each group. For all quartiles, median H3K4me3 levels for the hottest third were significantly higher than for the coldest third (Wilcoxon rank sum test, p < 6.4 x 10⁻⁵.)

An official website of the United States government
Here's how you know
Official websites use .gov
A
.gov website belongs to an official
government organization in the United States.
Secure .gov websites use HTTPS
A lock (
) or https:// means you've safely
connected to the .gov website. Share sensitive
information only on official, secure websites.
