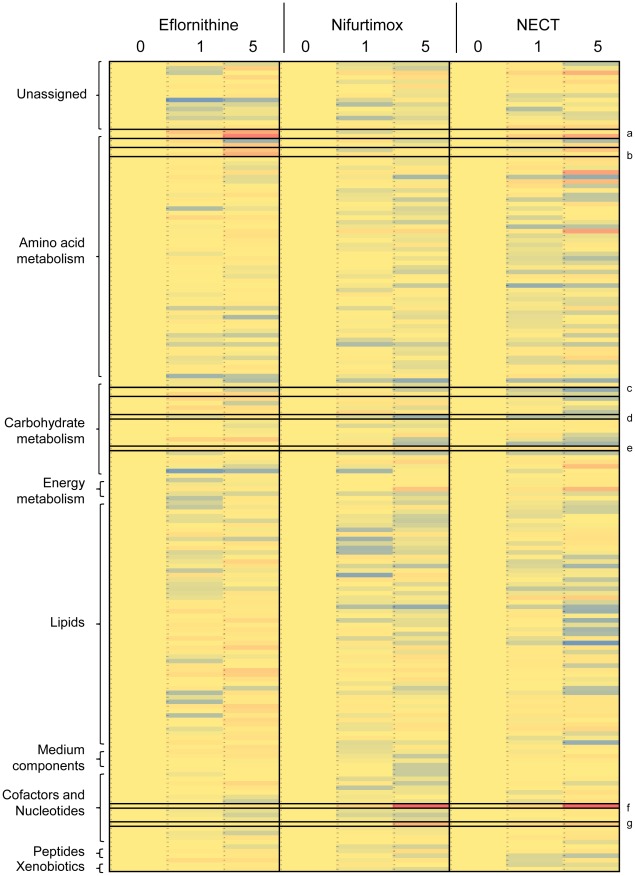
Figure 5. Heat map of metabolite levels in eflornithine, nifurtimox and NECT toxicity experiments.
Blue represents a decrease in metabolite intensity, red an increase and yellow represents unchanged levels compared to the levels at the 0 hour time point. Metabolites are classified down the left hand side. Metabolites of interest are emphasised with black boxes - a: acetylornithine and ornithine, b: methylthioadenosine and cystathionine, c: succinate and malate, d: hexose 6-phosphate, e: pentose 5-phosphate, f: adenine and g: uracil.

