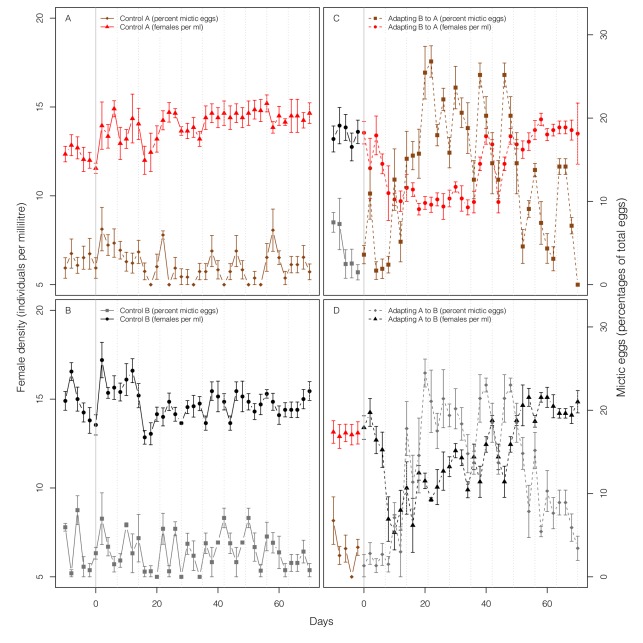
Figure 1. Female density and sexual investment in adapting and control populations.
Replicated rotifer populations were kept for 80 d either in the environment to which they were previously adapted (non-adapting controls, A and B) or moved to a novel environment after 10 d (C and D). (A) Control populations for Environment A, (B) control populations for Environment B, (C) experimental populations adapting to Environment A (B→A); (D) experimental populations adapting to Environment B (A→B). Female density is shown as triangles for populations originating from Environment A (A and D) and as circles for populations originating from Environment B (B and C); points in red (black) represent measurements made in Environment A (B). The percentage of eggs produced by mixis is shown as diamonds for populations originating from Environment A (C and D) and as squares for populations originating from Environment B (B and C); points in brown (grey) represent measurements made in Environment A (B). Error bars denote ±1 standard error. In both environments, investment in sex (measured as percent fertilized mictic eggs) increases and then declines over time for adapting populations (quadratic term: B→A, χ2 = 106.66, df = 1, p<2.2×10⁻¹⁶; A→B, χ2 = 115.58, df = 1, p<2.2×10⁻¹⁶); there is no such pattern for control populations. Dotted vertical lines mark the time points at which the fertilized mictic and amictic eggs were sampled to compare the fitness of sexual and asexual genotypes (Figure 2) and to measure the propensity of sex (Figure 3).

