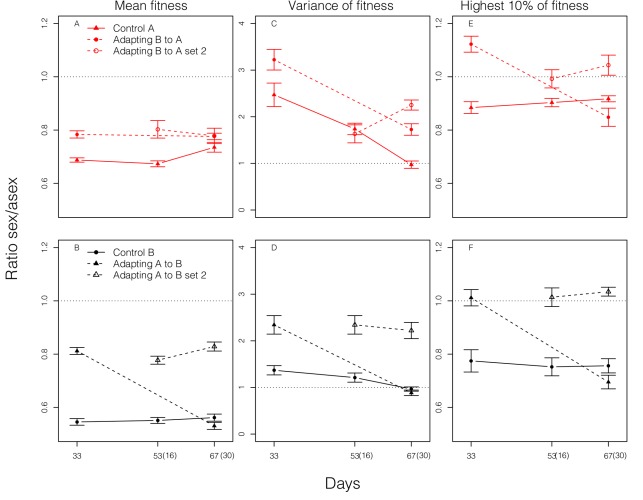
Figure 4. Short- and long-term effects of sex.
Comparisons in the distributions of lifetime reproduction between sexually and asexually produced offspring from random sets of parents. Distributions are based on genotypic values, each measured as the mean of five clonal replicates. For the first set of adapting populations, distributions are measured at day 33 and 67; for the second set of adapting populations, distributions are measured at day 53 and 67, corresponding to 16 and 30 d after their initiation, as shown in parentheses. Control populations are measured at each time. (A, B) Ratio (± standard error) of average fitness of sexually produced offspring to that of asexually produced offspring. (C, D) Ratio of variance in fitness of sexually produced genotypes to that of asexually produced genotypes. Variance is calculated as the variance among genotypic means. (E, F) Ratio of the mean fitness of the top 10% of sexually produced genotypes to that of asexually produced genotypes.

