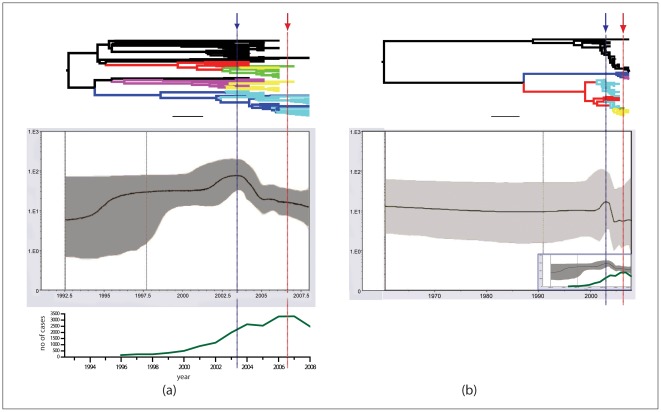
Figure 5. Evolutionary and transmission history of clade I and clade II.
Bayesian skyline plots showing the evolutionary and transmission histories of a) clade I and b) clade II and their corresponding trees. (a) also shows the number of human rabies cases recorded by year (bottom) and (b) shows the skyline plot for clade I on the same time scale (insert bottom right). Clade I shows greater variation in genetic diversity compared to clade II. Although both clades show a drop in genetic diversity around 2003 ((a) blue arrow on left), this is not correlated to number of human cases as they were still increasing rapidly and didn't peak until 2007 (red arrow on right of (a)). However, the drop appears to coincide with the introduction of translocation events, (a) and (b) top, as at this time multiple events appear in the trees.

