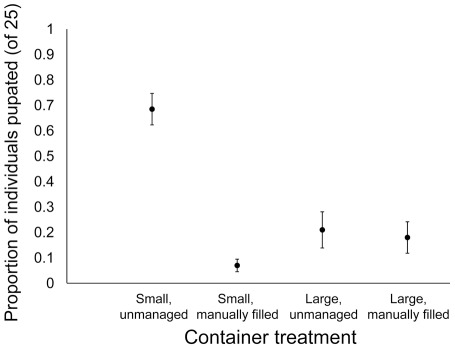
Figure 5. Standardized pupation probability by container type.
Mean (± SE) proportion of larvae from laboratory families that pupated during the experiment. Proportions were calculated by genotyping all collected pupae to identify those originating from laboratory families (25 F1 first instars introduced into each container). Data came from eight houses during the first trial.

