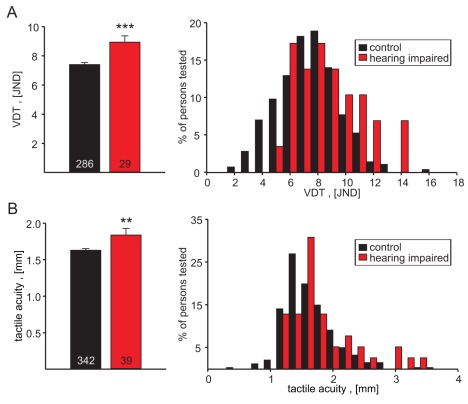
Figure 6. Touch sensitivity in a cohort of hearing impaired individuals compared to a cohort of normal hearing individuals.
Mean performances in the mean vibration detection threshold test as well as in the tactile acuity test were poorer in the hearing impaired cohort. ** p<0.01; *** p<0.001; t test.

