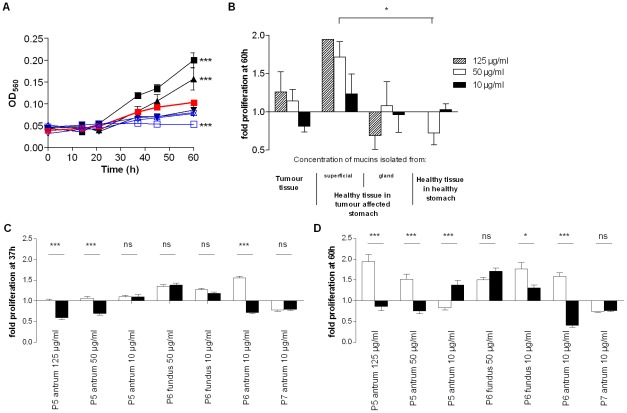
Figure 2. Concentration- and tissue-dependency of purified mucins for H. pylori J99 proliferation.
A) Concentration-dependency of one stimulatory (P5 TA-AS, black closed symbols) and one inhibitory mucin sample (P7 TA-AG, blue open symbols) on H. pylori proliferation comparing mucin concentrations of 125 (▪), 50 (▴) and 10 (▾) µg/mL to proliferation without mucins (bold red ▪). (***p≤0.001, One-way ANOVA, Dunnett t-test, compared to J99 without mucins after 60 h proliferation.) B) H. pylori fold proliferation level compared to PBS control after 60 h with mucins grouped by tissue type origin at 125, 50 and 10 µg/mL of mucin. (*p = 0.046, One-way ANOVA, Tukey's post hoc test.) C and D) H. pylori fold proliferation level compared to PBS control after 37 h and 60 h with mucins from superficial (white bars) or gland (black bars) mucosal tissue from the same individual. (***p≤0.001, *p<0.05, ns = not significant, Student's t-test.) Although the differences between gland and surface derived mucins was larger at 60 h than at 37 h, some of the growth curves had lost their parabolic growth by this time, which explains why the results for one sample is different at 60 h than at 37 h.

