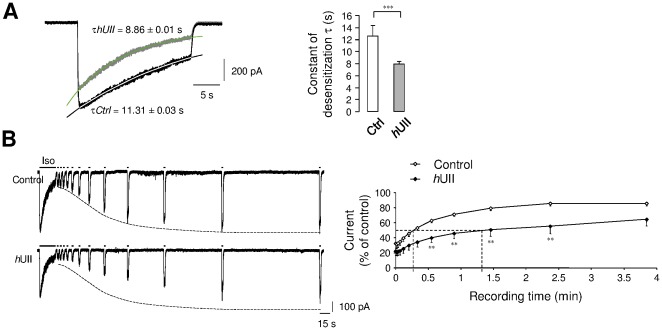
Figure 6. UII-induced fast current inhibition and GABAAR desensitization.
(A, B) Examples of currents recorded from CHO-UT-GABAAR during a long desensitizing pulse (25 s) of Iso (10−4 M), in the absence (black line) or presence (green line) of hUII (10−8 M, 1 min). (A) Exponential fit to the desensitizing current phases were shown overlaid on the currents. Bar graphs corresponding to the average desensitization constant parameter τ in the absence (τCtrl) or presence (τhUII) of hUII (n = 5). (B) Prolonged Iso (30 s) application eliciting current desenzitization followed by a time course of the recovery from desensitization, in the absence (control) or presence of hUII. Graph represents the Iso-evoked current expressed as a fraction of the peak control current induced by the long Iso application to the current amplitude elicited by each short pulse, and plotted against interpulse intervals. Data are mean ± SEM from 3 to 8 cells. *, P<0.05; ** P<0.01; *** P<0.001 compared with the corresponding control Iso-evoked current.

