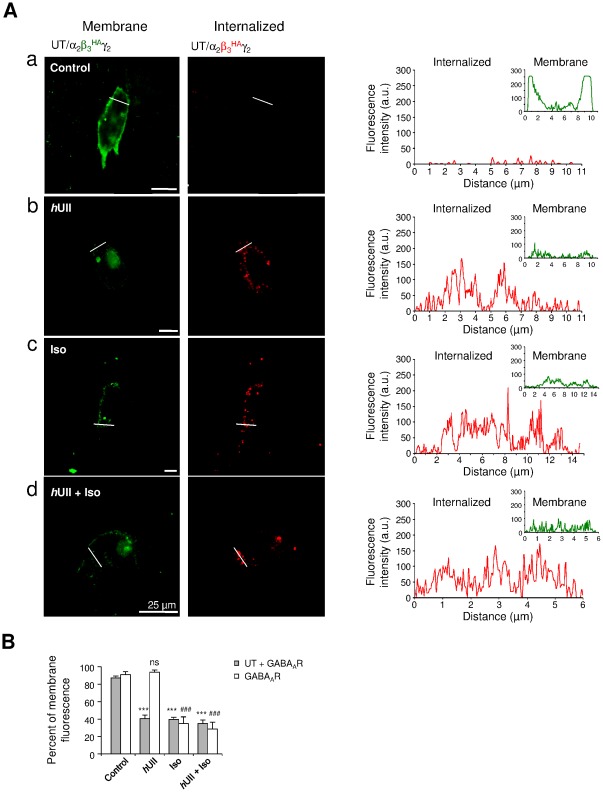
Figure 9. UT activation mediating GABAAR internalization.
(Aa–Ad) CHO-UT transiently transfected with cDNA encoding α2β3 HAγ2 GABAAR subunits. Internalization was controlled through translocation of β3 HA subunit (red) in control (Aa) or after 60 min of hUII (10−8 M, Ab), Iso (10−4 M, Ac) or hUII+Iso (Ad) incubation. Fluorescence intensity plots of green and red fluorescences corresponding to the localization of GABAAR (β3 HA) at the plasma membrane and in the cytosol, respectively, across the regions delimited by the white line scans. A.u., arbitrary unit; scale bars, 25 µm. (B) Bar graphs of the fraction of fluorescence at the plasma membrane on CHOT-UT-GABAAR or CHO-GABAAR in the different conditions. Each bar corresponds to mean ± SEM percent obtained from 3 to 18 cells. ns, non significant; ***, P<0.001 versus control in CHO-UT-GABAAR; ###, P<0.001 versus control in CHO-GABAAR.

