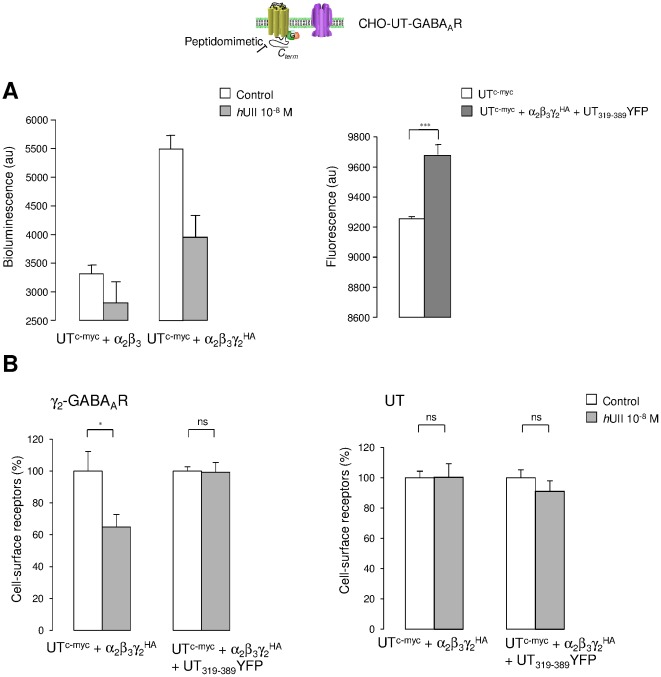
Figure 10. UII-induced GABAAR loss from the plasma membrane through the C-terminus fragment of UT in CHO.
The effect of hUII on the proportion of GABAAR and UT at the cell surface of CHO was assessed by ELISA. (A) CHO transiently transfected with cDNA encoding UTc-myc and α2β3, or α2β3γ2 HA GABAAR subunits (left), or UTc-myc, and α2β3γ2 HA GABAAR subunits cotransfected with the cDNA encoding UT319–389YFP (right). Background bioluminescence (left) and fluorescence (right) were measured after anti-HA antibody and colorimetric alkaline phophatase substrate incubation, in the absence or presence of 30 min of hUII (10−8 M, left), or directly on a fluorescent plate reader (right). (B) CHO transiently transfected with cDNA encoding UTc-myc and α2β3γ2 HA GABAAR subunits (left), or cotransfected with the cDNA encoding UT319–389YFP, and immunodetected with anti-HA (left) or anti-c-myc (right) antibodies. Percentage of cell surface γ2 HA GABAAR subunit (left) or UTc-myc (right) are represented as the proportion of receptor at the plasma membrane (non permeabilized cells) to the total expressed receptor (permeabilized cells). One hundred percent correspond to values in the absence of 30 min treatment with hUII (10−8 M, 37°C). Each bar corresponds to mean ± SEM percent obtained from 5 to 7 independent experiments, in triplicates. ns, non significant; *, P<0.05; ***, P<0.001.

