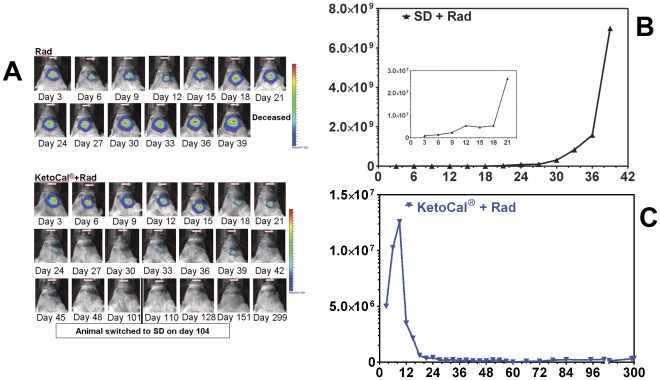
Figure 2. KetoCal® plus radiation treated animals experienced a loss of bioluminescence.
(A) Radiation and KetoCal® plus radiation animal imaged every three days. Color scheme represents signal intensity with red representing the highest intensity photon count. (B) (C) Bioluminescent signal plotted as in vivo photon count versus days post-implantation.

