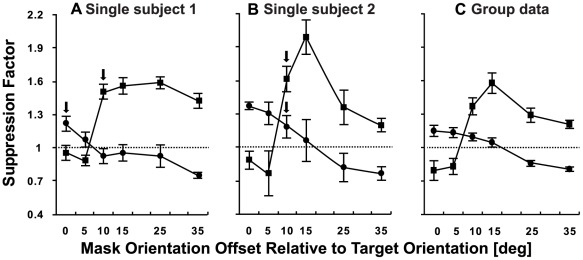
Figure 3. Psychophysical measurement of suppression for the surround (circles) and overlay masking (squares) conditions.
Panels A and B show individual participant data and C shows the mean group data. The suppression factor shown on the y-axis of each panel was calculated by dividing the detection threshold for the target alone by the threshold for the target + mask. Values above 1 (dashed line) indicate mask-induced suppression. Arrows in A and B indicate the mask orientations used for the tDCS portion of the study. Error bars represent ±1 SEM.

