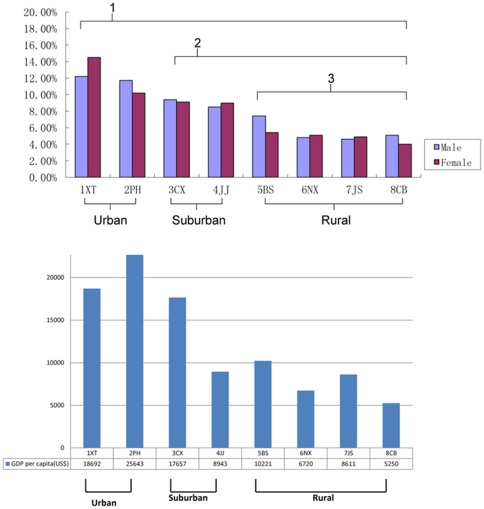
Figure 2. Prevalence of AD in different districts; GDP per capita in different districts.
Figure 2a Prevalence of AD in different districts. 1 The prevalence of Urban (#1XT and #2PH) showed statistically significant difference to that of other districts (P<0.05). 2 The prevalence of Suburban (#3CX and #4JJ) showed statistically significant difference to that of the rural areas (P<0.05). 3. Meanwhile the prevalence of different communities in each unit (Urban, Suburban and Rural) showed no statistically significant difference (P>0.05). Figure 2b GDP per capita in different districts. The prevalence of AD has significant correlation with GDP per capita in different districts.(rs = 0.786, P = 0.001)

