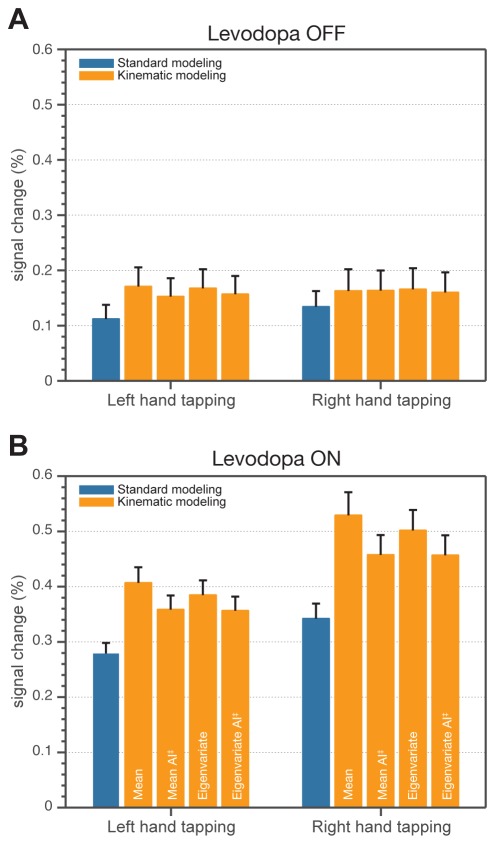
Figure 6. Comparison of modeling approaches as average effect size in anatomical ROI (left and right pallidum).
Each bar represents the average value from ROI for the ‘group-level mean’ PSC image, and each error bar the average of the ‘group-level standard error’ PSC image. A: Percent signal change for the Levodopa OFF condition and all modeling approaches. In contrast to the ON condition, in the OFF condition, the basal ganglia were not activated so the data corresponds to noise. B: Percent signal change for the Levodopa ON condition and all modeling approaches. AI‡ - amplitude invariant.

