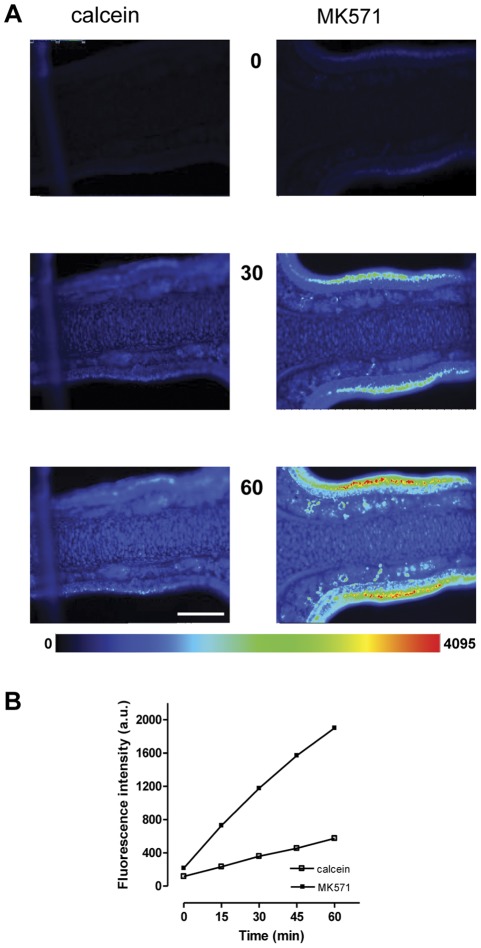
Figure 2. Calcein fluorescence in olfactory slices is elevated in the presence of an MDR inhibitor. A:
Time series images in pseudocolor of two individual mouse olfactory slices incubated with 1 µM calcein–AM (left panel), or concomitantly with 25 µM MK571 (right panel). The numbered images correspond to individual frames at indicated time points. Some pixel saturation occurred at the 60 min time point in the center portion of the OE in MK-treated slice. The two slices are from the same specimen, recorded with identical exposure times. B: Time-dependent accumulation of fluorescence intensity (arbitrary units, a.u) for calcein in the absence or presence of 25 µM MK571 as evaluated from regions of interest (ROIs), saturated pixels were not considered for evaluation. Data derived from above experiment. Values of the pseudocolor code bar scales from 0 (low, blue) to 4095 (high, red), scale bar in A = 200 µm.

