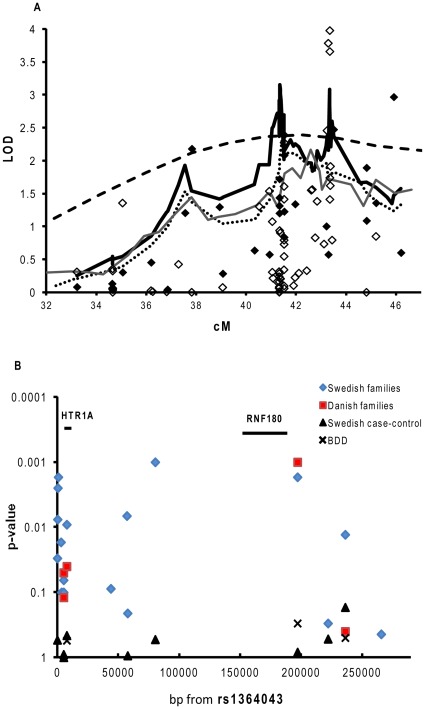
Figure 1. a–b. Linkage and association analysis in Scandinavian families and case-control cohort.
Linkage analysis of T1D on chromsome 5 in Swedish, -Danish and -Norwegian multiplex families (a). The dashed line represents multipoint linkage from the original scan in the Swedish, Danish and Norwegian families [4]. The thin dark grey line represents the “fine mapping” including 36 microsatellites in all Scandinavian families. A region between D5S407 and D5S428 (at approx 41.5 cM in figure) showed a linkage of LOD 2.16. The dotted line represents the Swedish families using all 40 microsattelites (multipoint). Here, D5S2000 showed strongest linkage (LOD 2.70). The black diamonds represent the “fine mapping” single point analysis in the Swedish families. In the singlepoint analysis for the Swedish families, D5S2048 showed strong linkage (LOD 2.97). The black thick line represents linkage in Swedish families to T1D on chromosome using an extra 4 microsattelites and 61 SNPs, reveiling three linked peaks where the most strongly linked region was the 5p13-q13 (at approx 43 cM on figure) region (LOD 2.7 for rs6295). In the singlepoint analysis using all 61 SNPs and 4 extra microsattelites (white diamonds) rs878567 and rs6295 showed genome-wide significant linkage (LOD 3.9 and LOD 3.65 respectively). Linkage was calculated using the Exponential Equal Weighting model in the Allegro program.SNP association for the Swedish sporadic cases and controls and Swedish and Danish multiplex families (b) was calculated from rs1158292 (63 001 317 bp) to rs6880454 (63 5028 02 bp). Swedish families (diamonds). Danish families (squares), DISS2 (triangles) and BDD (crosses). Association analysis was carried out in the Unphased program. For the BDD cohort, association was calculated using controls included in the Swedish (MS) EIMS study.

