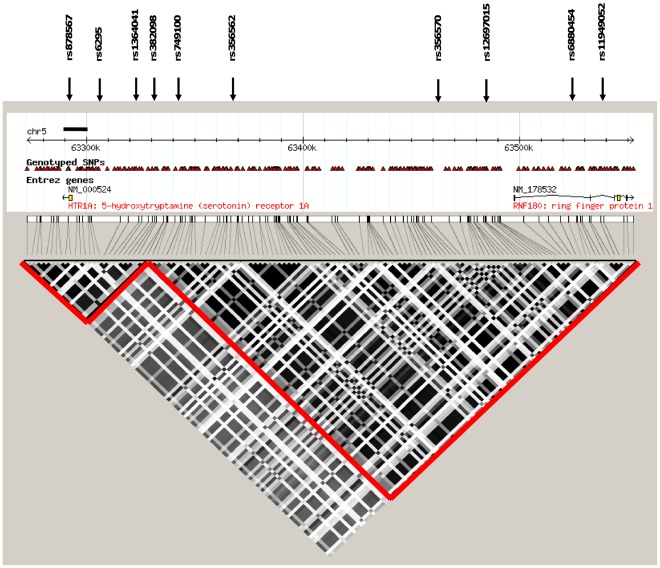
Figure 2. LD plot for HTR1A and RNF180.
LD-block of the HTR1A and RNF180 regions was obtained from Haploview using HapMap data. The linkage disequilbrium measure shown is r2 and the block definition is solid spine defined by Gabriel et al., [35]. HTR1A and RNF180 are situated in two separate blocks (r2 = 0.91 between the two blocks). When LD for the two associated SNPs (rs356570 and rs6880454) is calculated we observe a D́ value of 1 while r2 is 0.021. The SNPs in bold were typed to verify the involvement of RNF180 to T1D susceptibility. Rs12697015 tags three other SNPs located in the RNF180 downstream region. rs6880454 tags 17 additional SNPs on either side of RNF180. rs11949052 only tags for itself. Standard settings were used for tagging anlysis in Haplowiev. The bold lines indicate the HTR1A sequenced area.

