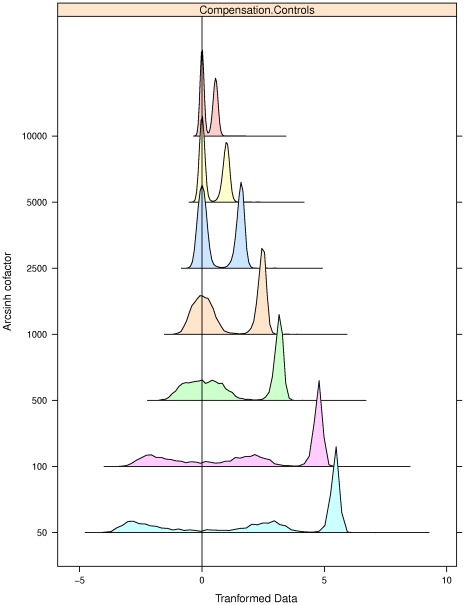
Figure 2. Selecting the optimal value of cofactor using flowScape.
The distributions of CompControl events after Arcsinh transformation based on different values of the cofactor are shown. The cofactor values that satisfied our tests were 2500 and 1000. For these values, we see that there is no spurious splitting of the 0-cluster, which produces distinctive negative clusters for cofactors less than 1000. On the other hand, for cofactors greater than 2500, the 0-clusters are clearly spiky. In contrast, the 0-cluster for the cofactor values optimized according to flowScape normality criterion is neither too peaked nor too flat. Thus flowScape addressed both problems of over- and under-transformation of data.

