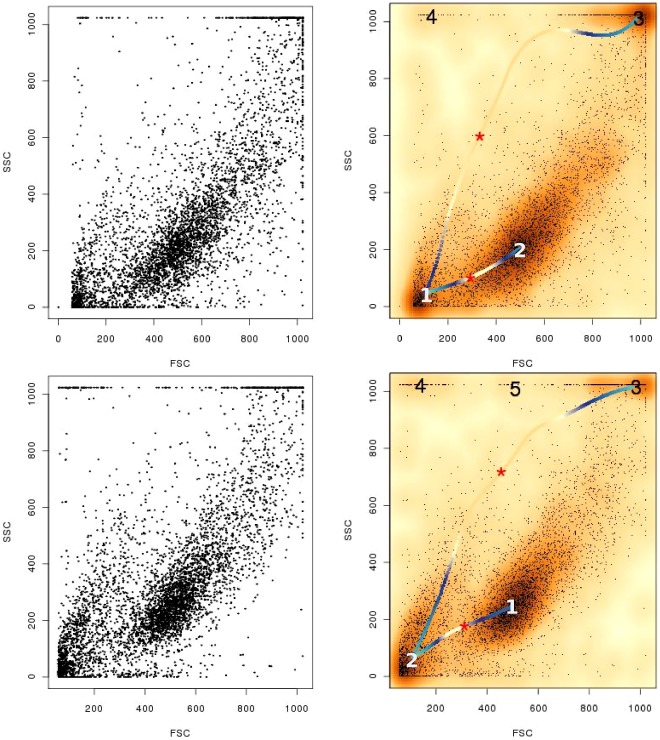
Figure 4. Objective isolation of cell populations.
In the left panel we show the scatterplots of two LCL samples in terms of forward- and side-scatters. Owing to the inter-connected nature of the distributions, extraction of the live cell population is difficult via automation. Using modal clustering and ridgeline analysis, flowScape provides algorithmic means to separate and extract the populations based on locations where the altitude of the ridgeline dips while moving from one peak to another, as marked with red asterisks. The ridgeline is colored according to its altitude at each coordinate.

