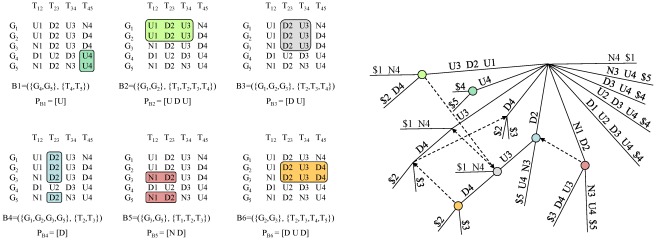
Figure 3. Transcriptional module identification: maximal biclusters.
This figure shows all transcriptional modules, or maximal CCC-Biclusters with at least two rows, obtained by applying CCC-Biclustering to the transformed matrix in Figure 2. Maximal CCC-Biclusters are represented: (left) in the transformed discretized matrix of Figure 2; and (right) in the generalized suffix tree built for the strings in the rows of this matrix.

