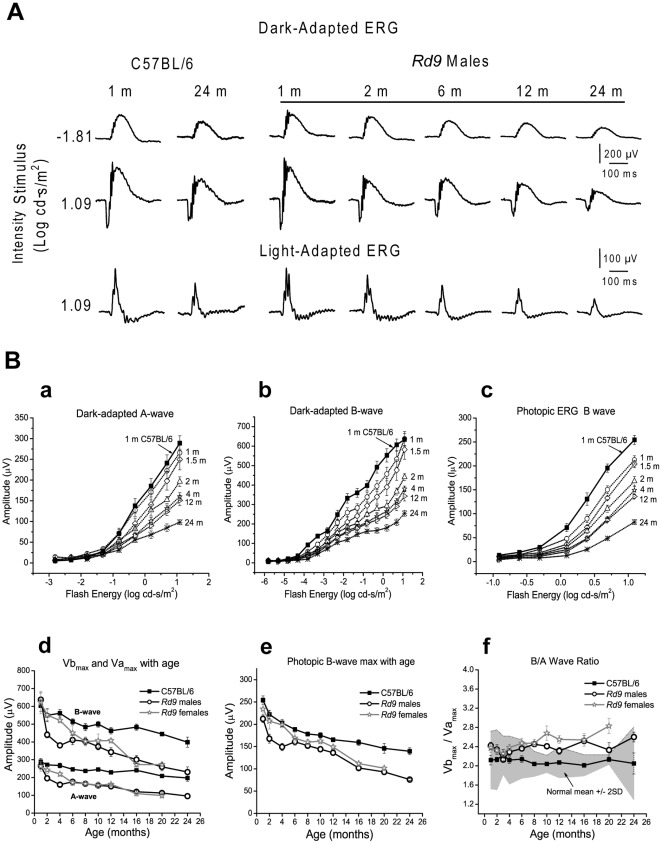
Figure 6. Electroretinogram (ERG) waveforms for Rd9 and wild-type mice.
A) Representative dark-adapted and light-adapted ERGs waveforms. For mice at 1 to 24 months-of-age, dark-adapted ERG recordings show the rod-mediated responses and maximal responses (rod plus cone), and light-adapted ERG recordings show the maximal cone-mediated responses. B) ERG intensity-response function V-Log I curves in Rd9 males (open symbols) at 1 (n = 10), 1.5 (n = 6), 2 (n = 13), 4 (n = 11), 12 (n = 11), and 24 months (n = 5) compared to 1-month-old B6 mice (filled squares). a) dark-adapted a-wave. b) dark-adapted b-wave. c) photopic b-wave. Natural history of maximum ERG amplitude (Mean ± SE) changes in Rd9/Y males, Rd9/Rd9 females, and B6 mice. d) Dark-adapted Vamax and Vbmax. e) Photopic Lmax. f) b/a wave ratio. Grey area represents the wild-type normal range.

