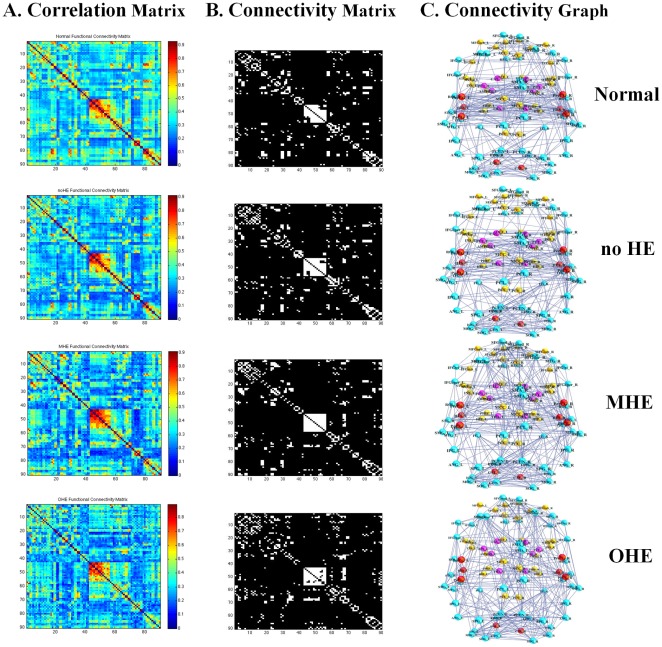
Figure 1. The Resting-state fMRI correlation matrices in the healthy control, no HE, MHE, and OHE groups.
The A. column displays the interregional correlation matrix for each group, obtained by calculating Pearson’s correlations between the regional brain areas across subjects within the group. The color bar indicates the correlation coefficient between regions. The B column displays the binary connectivity matrices with fixed network density thresholds of 10% [59]. The C column illustrates the corresponding brain connectivity graph. The correlation matrices were further thresholded into a set of binary matrices to construct the functional networks.

