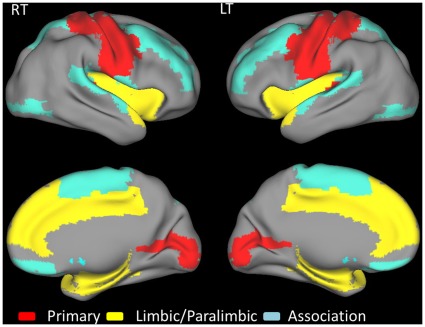
Figure 6. Group differences in nodal strength and relative and absolute efficiency between the healthy controls and patients with the severity of HE (Table 3).
The figures show significant between group increases in the stages of HE for the left and right hemisphere.

