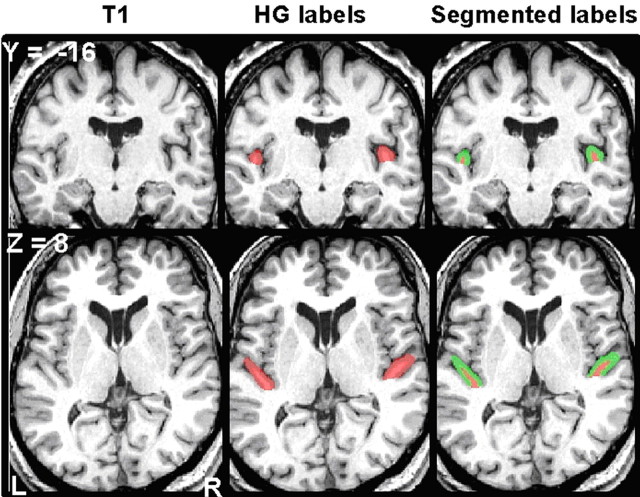
Figure 1.
A representative T1 volume is shown in coronal (top, y = −16) and axial (bottom, z = 8) sections. Left column, Original unmarked scan. Middle column, Location of manual HG labels in red. Right column, HG labels segmented into gray and white matter, shown in green and red, respectively. L, Left; R, right.

