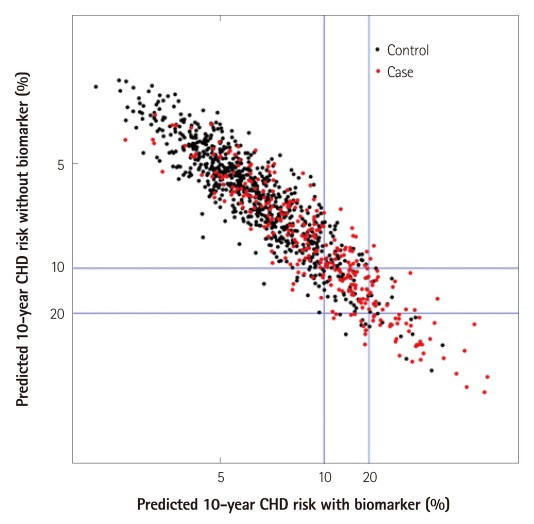
Fig. 5.
Simulated scatter plot showing the performance of two prediction models. Both X and Y axes are in logarithmic scales. Red dots indicate people who developed CHD, and blacks dots indicate people who did not. Blue lines indicate cut-off points determining risk categories. CHD: coronary heart disease.

