Fig. 1.
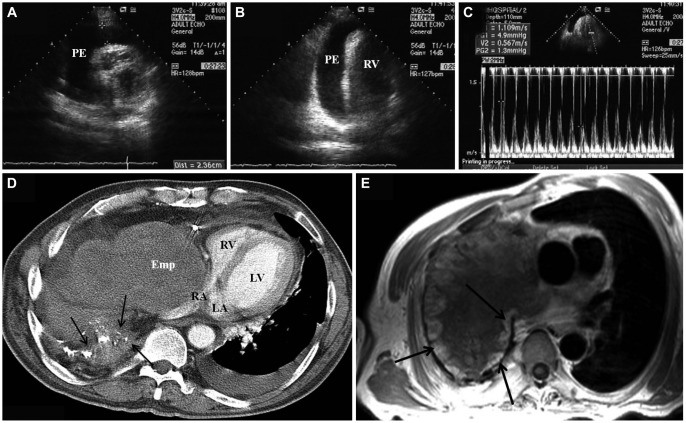
A and B: a short-axis and an apical 4-chamber transthoracic echocardiography view demonstrated a pericardial effusion of over 2 cm around the free wall of the right ventricle. C: respiratory variations of transmitral Doppler inflow: a decrease of peak flow velocity with >25% (from 1.1 to 0.5 m/s) during inspiration. D: post contrast CT at the level of the left ventricle. The large mass with a mean CT number of 40 is empyema. Note the thick pleura with calcifications (arrows), and this represents a fibrothorax from the tuberculosis. The right atrium is markedly compressed by the empyema. A small to moderate amount of left pleural effusion is noted (the mean CT number is 25). E: axial image of chest MRI. A large mass in the right thorax compresses the right heart and vena cava. The mass has a lobular fibrous capsule of high signal intensity and a central low signal intensity. The thick fibrous capsule shows various degrees of enhancement (arrows). FA of 180 degrees, a TR of 976 milliseconds and a TE of 12 milliseconds. PE: pericardial effusion, Emp: empyema, RA: right atrium, RV: right ventricle, LA: left atrium, LV: left ventricle.

