Figure 5.
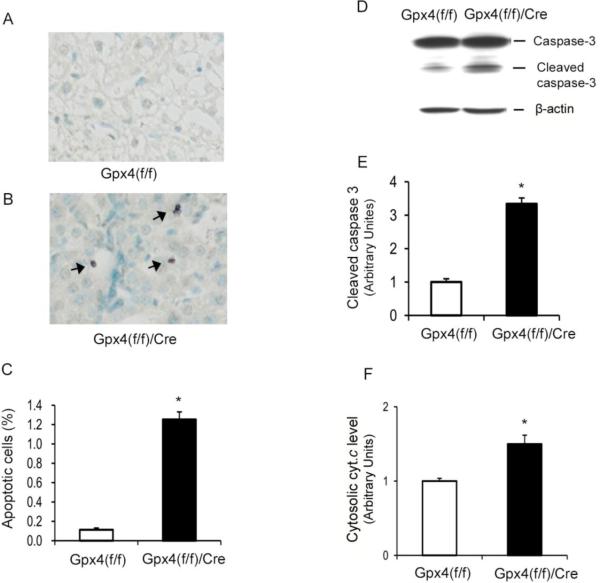
Elevated apoptosis in livers from tam-treated Gpx4(f/f)/Cre mice.
A&B. Graphs of liver sections stained for the presence of double-strand DNA breaks from tam-treated Gpx4(f/f) mice (A) and tam-treated Gpx4(f/f)/Cre mice (B). Arrows indicate cells positive for double-strand DNA breaks. C. The levels (expressed as percentages) of apoptotic cells in livers of tam-treated Gpx4(f/f) mice and tam-treated Gpx4(f/f)/Cre mice. The values are expressed as mean ± SEM. *: p<0.05. n=3. D. A graph of Western blots showing levels of caspase-3 and cleaved caspase-3 in tam-treated Gpx4(f/f)/Cre mice and tam-treated Gpx4(f/f) mice. E. The levels of cleaved caspase-3 in tam-treated Gpx4(f/f) mice and tam-treated Gpx4(f/f)/Cre mice. F. The levels of cytosolic cyt. c in tam-treated Gpx4(f/f) mice and tam-treated Gpx4(f/f)/Cre mice. The mean level of cleaved caspase-3 or cytosolic cyt. c in Gpx4(f/f) mice was assigned as 1 arbitrarily, and the relative data representing mean ± SEM are shown. *: p <0.05, n=3.

