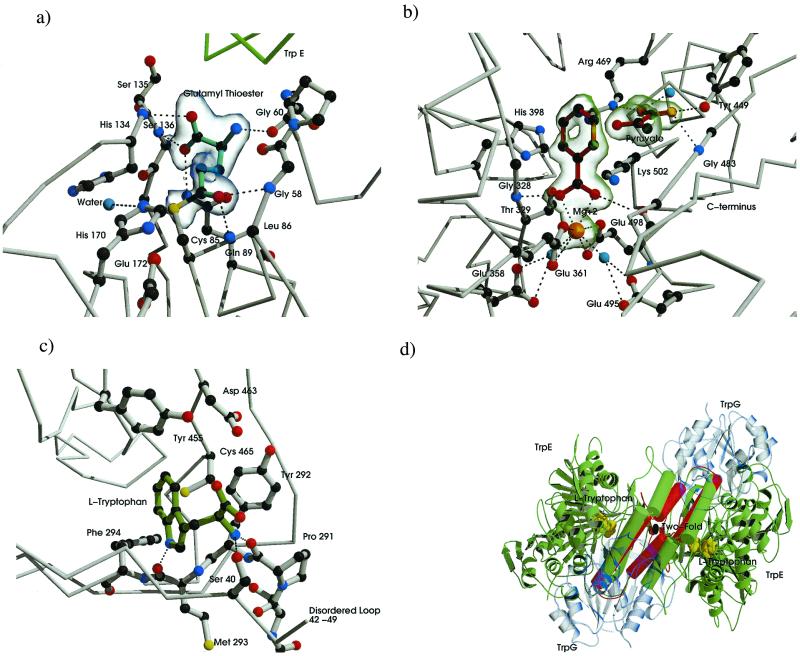
Figure 3.
Substrate product and Trp-binding sites of the AS molecule. Carbon atoms are dark gray, nitrogen blue, and oxygen red. Electrostatic and hydrogen-bond interactions are shown as black dotted lines. (a) Binding residues for glutamyl thioester intermediate of TrpG. Glutamyl moiety drawn with cyan bonds. A σA-weighted Fo−Fc map contoured at 3.5 SD is shown in transparent blue. (b) CA-binding pocket, anthranilate, and pyruvate are drawn with dark red bonds, magnesium ion in orange, ordered waters in cyan. A σA-weighted Fo−Fc map contoured at 3.0 SD is shown in transparent green. (c) Trp-binding pocket, tryptophan shown in green. (d) Conformational states associated with anthranilate, pyruvate, and Trp-bound forms. The molecule is viewed with the molecular 2-fold perpendicular to the page (i.e., perpendicular to the view in Fig. 2a). TrpG subunits shown in transparent blue, α helixes and loops involved in heterotetramer rearrangement shown as rods, C-crystal representation shown in green rearrangement in the T-crystal, shown in red. Tryptophan is shown as cpk model in yellow. Produced by bobscript and raster 3d (39–42).

