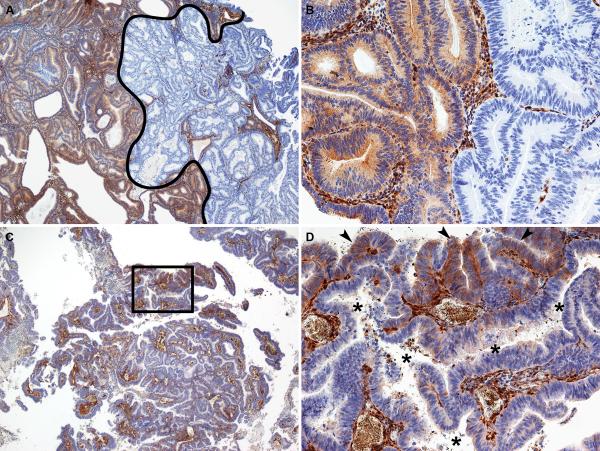
Figure 2.
Representative photomicrographs of different patterns of PTEN heterogeneous immunohistochemistry. (A and B) Geographic pattern of PTEN heterogeneous immunohistochemical expression. In A, the portion of the tumor to the right of the black line represents a large area that is negative for PTEN immunohistochemistry, while the area to the left is positive for PTEN immunohistochemistry. A higher magnification of the positive-negative interface is shown in B. For the geographic pattern, the interface between the positive and negative areas is typically sharp and abrupt. (C and D) Focal pattern of PTEN heterogeneous immunohistochemical expression. In this case, the vast majority of the tumor is PTEN negative. D represents a higher magnification view of the area outlined by the rectangle in C. In D, it is clear that small foci of the tumor are immunohistochemically positive for PTEN (arrowheads), while a large, irregular malignant gland immediately adjacent is PTEN negative (asterisks in gland lumen). Note that in this pattern, the interface between PTEN positive and negative areas is more subtle. Note also that the intervening tumor stroma has uniformly strong PTEN staining throughout the tumor. A and C, 4×; B and D, 20×.

